Estate Agent Closures Loom As Putney Flat Sales Slump Further
Local independent firms hoping difficult market will squeeze out chains
The collapse in the number of sales of flats in SW15 has continued according to the latest official figures. Less than 100 units have been reported as sold in Putney and Roehampton during the second quarter close to historical lows for that section of the market.
Although asking prices remain comparatively similar to last year with the average sale price just over £700,000, the large fall in sales volumes is putting local estate agents under pressure to compete in a shrinking market. Local independent agents are hoping these are conditions which will squeeze out the more recently arrived branches of larger chains. There are some reports of some offices going for over a month without recording a single sale.
Leading local estate agent Allan Fuller noted that there had been a surge of flat buying by investors in 2016 to beat the 3% rise in stamp duty adding, "Since then investor activity has been very subdued, this inevitably has resulted in lower activity levels this year. The figures should really not come as a surprise. There are various factors influencing property at the moment. You cannot discuss property, or practically any other area of commerce, without mentioning Brexit. Whatever your personal views might have been it has hit confidence hard in London and the south East, with many uncertain of job futures. It would help if there was some sign of positive progress in the negotiations."
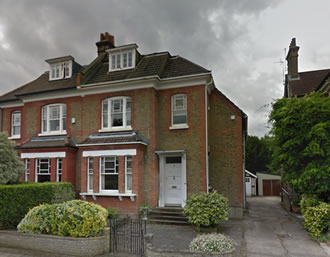
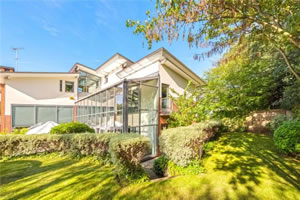
Demand for larger family properties appears to be relatively robust with some high priced sales going through recently. A six bedroom property believed to have been built in 2003 achieved a sale price of £3,175,000 in April on Paddock Way (pictured above) and a six bedroom semi-detached house on Dryburgh Road (pictured below) sold for £2,300,000.

Bucking the trend Dryburgh Road sold at £2,300,000
Allan Fuller continued,"George Osborne in 2015 had the not so bright idea to vastly changed stamp duty on property, or I prefer to say tax on buying property, if it’s a tax why not be honest and say so?
His hike in tax was designed in my opinion as a vote catcher, instead it is a disincentive to move. For example if you’re thinking of buying at over £1.5m the tax is 12%, if it’s a second home, it is 15% so little wonder that people are not buying at the upper levels. This is having a knock on effect because the normal flow of families moving up market has stalled, and likewise elder property owners who would downsize are not able to sell. "
However he reports that his office has been busy during August which is normally a quite month with the Bank of Mum and Dad coming into play to facilitate first time buyers and the lettings market busy as recent graduates move to London to take up jobs although there has been some softening of rents.
He concludes, "
The general outlook is that property values will tend to drift or remain static, but this will be related to location. we are lucky in Putney and locally because our area is immensely popular, parts of London that became trendy and rose rapidly could well suffer price drops."

Political uncertainty and the aftermath of tax changes are the obstacles hindering the London housing market, according to the latest RICS UK Residential Market Survey. This July, the surveyors’ organisation’s headline price growth indicator in London slipped from a net balance of -45% to -48%, continuing a run of consecutive negative readings since March 2016. When surveyors were asked about prices at the top end of the market (properties listed at over £1 million) they reported that this sector was seeing the greatest deviation in agreed prices, with 68% of respondents reporting sales prices coming in below the asking price. Whilst the RICS say this is not uncommon in a flatter market, 33% of respondents said the agreed price was up to 5% below the asking price and 26% reported between 5% and 10% under.
Looking ahead, London near term price expectations among surveyors continue to signal a declining trend over the coming three months, the eighth consecutive reported negative reading. Over the next twelve months, respondents in central London are now anticipating a decline in prices.
Alongside this, the capital’s sales activity continues to lack momentum, with the net balance readings for buyer enquiries and agreed sales remaining slightly negative, at -9% and -13%, respectively. Respondents are not anticipating activity in the sales market to gain impetus, with both the three and twelve month expectations series slightly negative.
In the lettings market, London rents are predicted to remain in decline, which has been, a trend present over the last six quarters.
Simon Rubinsohn, RICS Chief Economist, commented, “Sales activity in the housing market has been slipping in the recent months and the most worrying aspect of the latest survey is the suggestion that this could continue for some time to come. One reason for this is the recent series of tax changes but this is only part of the story. Lack of new build in the wake of the financial crisis is a more fundamental factor weighing on the market. And there are some very real consequences for the economy from all of this including the impact on the ability of people to be mobile when looking for work. The flatter trend in price growth is arguably a silver lining but there is no real indication that the housing market will become materially more affordable anytime soon.”
The numbers below are subject to revision as is it usual that some properties are added late to the Land Registry's database.
| Putney Property Prices (April to June 2017) | ||||||||||
|---|---|---|---|---|---|---|---|---|---|---|
| Area | Detached | Sales | Semi-detached | Sales | Terrace | Sales | Flat/ mais |
Sales | Overall Ave | Overall Sales |
| SW15 1 | 0 | 0 | 1588000 | 3 | 1157000 | 8 | 558656 | 9 | 952395 | 20 |
| SW15 2 | 1675000 | 1 | 1210667 | 3 | 1117855 | 10 | 562046 | 27 | 772215 | 41 |
| SW15 3 | 2137500 | 2 | 540000 | 2 | 665000 | 4 | 464323 | 22 | 607670 | 30 |
| SW15 4 | 0 | 0 | 0 | 0 | 0 | 0 | 288333 | 6 | 288333 | 6 |
| SW15 5 | 2000000 | 1 | 879000 | 5 | 667500 | 12 | 394453 | 8 | 675409 | 26 |
| SW15 6 | 2650000 | 1 | 865000 | 1 | 882875 | 4 | 498147 | 19 | 660452 | 25 |
| Total | 2120000 | 5 | 1052571 | 14 | 911475 | 38 | 491964 | 91 | 707708 | 148 |
| Last quarter | -4.4% | -16.7% | -19.9% | 16.7% | -17.6% | 58.3% | -12.0% | -27.8% | -5.7% | -11.9% |
| Last year | 15.1% | -16.7% | -13.1% | 75.0% | 9.2% | 52.0% | -19.6% | -29.5% | -1.4% | -11.9% |
| Last three years | -27.7% | -77.3% | -23.8% | -36.4% | -6.6% | -24.0% | -1.5% | -60.8% | -11.1% | -54.6% |
| Last five years | -3.3% | 66.7% | 11.3% | 40.0% | 20.4% | -17.4% | 22.7% | -28.9% | 29.5% | -20.9% |
| Last ten years | -6.9% | -66.7% | 19.2% | -41.7% | 46.4% | -29.6% | 43.0% | -66.9% | 41.8% | -59.8% |
Copyright
notice: All figures in this article are based on data released by the
Land Registry. The numbers are derived from analysis performed by PutneySW15.com.
Any use of these numbers should jointly attribute the Land Registry and
PutneySW15.com.
September 1, 2017
Related links
|
