Brexit Blamed As Market for Flats in Putney Weakens Significantly
Leading local agent believes buyers should 'buy now while stocks last'

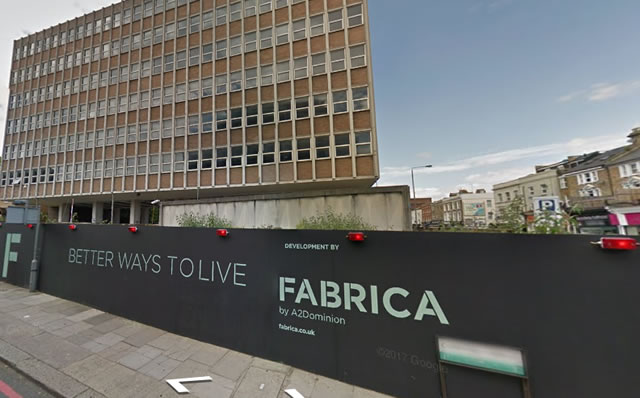
Next development on the Upper Richmond Road & Carlton Drive junction
(Google Streetview)
A collapse in the number of flats being sold in the SW15 so far this year is being blamed on concerns over Brexit by a leading local estate agent. However, his advice is that the current dip presents a buying opportunity.
According to the latest figures from the Land Registry, for the third quarter in a row both prices and number of sales for flats in Putney and Roehampton has fallen. Only 78 have been reported as been sold so far this year at an average price well down on previous peaks.
Allan Fuller believes, "The main factor that is influencing the London property market is still Brexit, and may well be until the outcome is clearer. This is not the case in many areas outside the capital. The London economy is heavily linked to the financial world in the City, so many jobs are dependent on it or linked to it, banks, financial house, investment businesses, investment traders, are the obvious ones, but lawyers and a host of service industries as well. Until it is clear what jobs will be lost or transferred to Europe a lot of people both in owned and rented property are not moving home, so this is accounting for fewer transactions. "
Concern is being expressed at the market's capacity to take the large number of units that will be built in developments in the area if buyer interest remains at these levels.
However Allan Fuller believes there is still strong underlying demand for flats in Putney, "Overseas buyers are benefiting from an effective 20% drop in price because of the plummet in the value of the pound, the extra 3% on the purchase price from the increase in stamp duty therefore is largely negated. All of the new flats along the Upper Richmond Road are now sold, with a new block due on the corner of Carlton Drive and I am sure these will also".
Overall, the local property market hasn't been performing badly in price terms recovering from the dip seen at the end of 2016. The average price in the SW15 post code area is £787,905 up by 5.4% over the year but still below record levels. Activity at the top end of the market seems to be holding up relatively well.

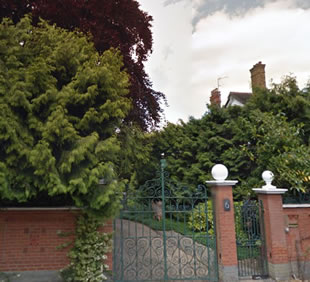
Heathview Gardens house sold for £6,850,000
In January an eight bedroom house, hidden behind mature trees and redbrick wall, on Heathview Gardens sold for £6,850,000 to become the fourth highest price house in the area. Two of the more expensive ones are also on Heathview Gardens. Heathview Gardens is regarded by local agents as ' one of the most sought after addresses'. The most expensive home ever sold in the SW15 area was a six bedroom house on Priory Lane which changed hands for £15,000,000 last year.
Allan continued, "My office are readily finding buyers for sensibly priced property, this is the case for both sales and lettings, and buyers are encouraged right now by the incredibly low interest rates for mortgages, so motto for them must 'be buy now while stocks last'. "
Simon Rubinsohn, RICS Chief Economist sees the lettings market as being stronger than the sales side. He said, "It is noticeable that the amount of new rental instructions coming through to agents is continuing to edge lower, which is not altogether surprising given the changing landscape for buy-to-let investors. One consequence of this is that rents are expected to continue rising not just in the near term but also further out and at a faster pace than house prices."
During March 2017 London was the worst performing region of the country according to the Land Registry with prices falling by 1.5% from the previous month to £471,742. Over the course of the last twelve months prices have risen by 1.5%.
For England as a whole prices are up by 4.4% in the year to March rising to an average of £232,530.
The number of completed house sales in London in January, the latest month for which figures are available, fell by 26.3% to 5,968 compared with 8,093 in January 2016.
The numbers below are subject to revision as is it usual that some properties are added late to the Land Registry's database.
| Putney Property Prices (January to March 2017) | ||||||||||
|---|---|---|---|---|---|---|---|---|---|---|
| Area | Detached | Sales | Semi-detached | Sales | Terrace | Sales | Flat/ mais |
Sales | Overall Ave | Overall Sales |
| SW15 1 | 0 | 0 | 2354750 | 2 | 1321714 | 7 | 625357 | 7 | 1146187 | 16 |
| SW15 2 | 0 | 0 | 1373333 | 3 | 1181250 | 4 | 612688 | 21 | 775409 | 28 |
| SW15 3 | 2642500 | 4 | 807500 | 2 | 320000 | 1 | 539471 | 17 | 903167 | 24 |
| SW15 4 | 1900000 | 1 | 0 | 0 | 0 | 0 | 259500 | 5 | 532917 | 6 |
| SW15 5 | 700000 | 1 | 647500 | 2 | 759308 | 7 | 492025 | 10 | 611520 | 20 |
| SW15 6 | 0 | 0 | 2750000 | 1 | 655000 | 1 | 514548 | 18 | 633343 | 20 |
| Total | 2195000 | 6 | 1448950 | 10 | 1013358 | 20 | 537110 | 78 | 787905 | 114 |
| Last quarter | -20.2% | 200.0% | -17.9% | 0.0% | 2.8% | -60.8% | -6.4% | -46.6% | 4.7% | -45.5% |
| Last year | 20.7% | -25.0% | 9.5% | -63.0% | 1.6% | -68.3% | -11.0% | -71.3% | 5.1% | -69.2% |
| Last three years | 42.5% | -14.3% | 0.0% | -41.2% | 27.8% | -57.4% | 25.1% | -63.0% | 36.1% | -59.6% |
| Last five years | 36.3% | 0.0% | 12.4% | -41.2% | 32.9% | -56.5% | 49.5% | -38.6% | 37.5% | -41.8% |
| Last ten years | 56.4% | 100.0% | 93.3% | -56.5% | 75.8% | -64.9% | 68.4% | -66.2% | 93.3% | -63.7% |
Copyright
notice: All figures in this article are based on data released by the
Land Registry. The numbers are derived from analysis performed by PutneySW15.com.
Any use of these numbers should jointly attribute the Land Registry and
PutneySW15.com.
May 19, 2017
Related links
|
