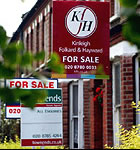
Luxury Putney Home Buying Splurge Ends
Smaller properties see most interest in recent months
The huge buying interest in top-end Putney properties which drove the average price in the area to all-time highs appears to have evapourated.
In in last quarter sales of detatched and semi-detatched properties in the area fell by around 75% This brought the average price for an SW15 property down to £475,437 in the fourth quarter of 2011 according to Land Registry figures a significant drop from the previous three months.
However, at the less expensive end of the market the picture is more favourable. Flat prices rose over the quarter and sales volumes were up by 53.1% over the same period last year possibly due to first time buyers wanting to take advantage of the Stamp Duty exemption which expires next month.
 Local agent Allan Fuller commented on the recent figures:
"Property is a pyramid, with naturally fewer expensive properties at the top, so there will always be less transactions of larger houses. Also for property taking just a 3 month snapshot is too short period to draw meaningful conclusions. The truth that the figures mask is that there may have been fewer transactions simply because there are less sales due to a lack of property, I can confidential say the demand is there, we just need the property to satisfy it!
He continued:
"
Given that current economic conditions are having a more sever effect on parts of the country other than London it can be no surprise that average values have slipped back. London and most of the South East is effectively a different economy. The desirability of areas such as Putney ensure that there is plenty of demand and our records show that values here are well in excess of the peak of the market at the end of the last boom in 2007. Statistics can often be confusing, but if you really want to know what your home is worth give me a ring!"
The December data from Land Registry's flagship House Price Index shows an annual price decrease of 1.3% which takes the average property value in England and Wales to £160,384.
The only region in England and Wales to experience an increase in its average property value over the last 12 months is London with a movement of 2.8% to £345,298. The North East experienced the greatest annual price fall with a decrease of 7.1% and the most significant monthly price fall with a decrease of 1.9%.
The most up-to-date figures available show that, during October 2011, the number of completed house sales in England and Wales decreased by 6% to 55,309 compared to 58,634 in October 2010. The number of properties sold in England and Wales for over £1 million in October 2011 decreased by 10% to 525 from 582 in October 2010.
Putney Property Prices (October - December 2011)
| Area | Detached | Sales | Semi-Det | Sales | Terrace | Sales | Flat/ Mais |
Sales | Total Ave | Total Sales |
|---|---|---|---|---|---|---|---|---|---|---|
| SW15 1 | 0 | 0 | 1094000 | 5 | 861772 | 11 | 474789 | 19 | 684871 | 35 |
| SW15 2 | 0 | 0 | 0 | 0 | 723202 | 9 | 400388 | 42 | 457355 | 51 |
| SW15 3 | 1637000 | 4 | 0 | 0 | 0 | 0 | 354250 | 42 | 465793 | 46 |
| SW15 4 | 0 | 0 | 0 | 0 | 0 | 0 | 169950 | 10 | 169950 | 10 |
| SW15 5 | 0 | 0 | 0 | 0 | 573173 | 23 | 333050 | 18 | 467753 | 41 |
| SW15 6 | 0 | 0 | 0 | 0 | 590000 | 3 | 430235 | 65 | 437283 | 68 |
| Total | 1637000 | 4 | 1094000 | 5 | 672637 | 46 | 389671 | 196 | 475437 | 251 |
| Last quarter | -19.9% | -73.3% | -0.7% | -79.2% | 0.7% | -25.8% | 6.0% | 5.9% | -18.3% | -12.2% |
| Last year | 143.1% | 33.3% | 9.9% | -66.7% | -8.4% | -22.0% | 11.9% | 53.1% | -7.1% | 22.4% |
| Last three years | - | - | - | - | 27.4% | 130.0% | 12.6% | 180.0% | 23.0% | 178.9% |
| Last five years | 13.6% | -80.0% | 28.7% | -77.3% | 31.6% | -42.5% | 23.6% | -21.3% | 5.7% | -32.3% |
Copyright notice: All figures in this article are based on data released by the Land Registry. The numbers are derived from analysis performed by PutneySW15.com. Any use of these numbers should jointly attribute the Land Registry and PutneySW15.com.
February 9, 2012
Related links
|
