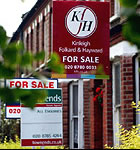
Putney Property Prices Reach New High
Sales of larger homes drive average price to record levels
The average price for Putney property sales has reached an all time high at £582,237 in the third quarter of 2011. This is up 7.3% compared with same period last year.
However the numbers should be treated with some caution - for the important driver of the average price has been the significant number of detached properties sold in that period; 15 at an average of £2 million in a total of 286.
Whereas the average prices for sales of flats and terraced houses were actually below levels seen three years ago. The overall average price was up by 26.5% over the last five years but flat prices were only up by 12.2%.
Sales volumes are seen to be recovering, in this third quarter they were double the levels seen three years ago but not back to where they were before the financial crisis.
The September data from Land Registry's House Price Index shows an annual price decrease of 2.6% which takes the average property value in England and Wales to £162,109. The only region to experience an increase in value over the last 12 months was London with a rise of 2.7%.
The most up-to-date figures available show that during July 2011, the number of completed house sales in England and Wales decreased by 11 per cent to 59,919 from 67,475 in July 2010. The number of properties sold in England and Wales for over £1 million in July 2011 decreased by 24 per cent to 707 from 932 in July 2010.
 Local agent Allan Fuller commented on the recent figures:
"Statistics can be manipulated to try and prove various theories, there is no doubt that a greater volume of high end sales, and fewer sales in the lower first time buyer market, can be construed as a skewed result."
He continued:
" The reality is however that these figures just confirm what we know from our sales this year; Putney is immensely popular and has more than recovered from the dip in 2008. Values are created by supply and demand, the supply is limited and demand remains strong in the popular parts of London, and especially areas with as much to offer as Putney."
According to the Nationwide's House Price Index which looks at offered prices rather that transacted sales UK house prices increased by 0.4% in October, lifting annual house price growth into positive territory for the first time in six months. The price of a typical home at £165,650 was 0.8% higher than October 2010.
Commenting on the figures, Robert Gardner, Nationwide's Chief Economist, said:
“Given the challenging economic backdrop, October’s data is encouraging, but it doesn't fundamentally change the picture of a housing market that is treading water. Property transaction levels remain subdued, and prices essentially flat compared to last year. The outlook remains uncertain, but with the UK economic recovery expected to remain sluggish, house price growth is likely to remain soft in the period ahead, with prices moving sideways or drifting modestly lower over the next twelve months.”
Putney Property Prices (July - September 2011)
| Area | Detached | Sales | Semi-Det | Sales | Terrace | Sales | Flat/ Mais |
Sales | Total Ave | Total Sales |
|---|---|---|---|---|---|---|---|---|---|---|
| SW15 1 | 0 | 0 | 1360000 | 7 | 899010 | 19 | 450760 | 33 | 702988 | 59 |
| SW15 2 | 0 | 0 | 1047800 | 5 | 728735 | 7 | 405368 | 46 | 499777 | 58 |
| SW15 3 | 2025666 | 3 | 594940 | 5 | 951999 | 3 | 334605 | 28 | 545555 | 39 |
| SW15 4 | 0 | 0 | 0 | 0 | 279375 | 4 | 184021 | 7 | 218695 | 11 |
| SW15 5 | 1374999 | 4 | 0 | 0 | 489888 | 17 | 278330 | 18 | 483026 | 39 |
| SW15 6 | 2386109 | 8 | 1242142 | 7 | 576583 | 12 | 355346 | 53 | 669203 | 80 |
| Total | 2044391 | 15 | 1101196 | 24 | 667789 | 62 | 367689 | 185 | 582237 | 286 |
| Last quarter | 9.3% | 400.0% | -7.3% | 300.0% | -20.3% | 44.2% | -0.5% | 48.0% | 8.5% | 61.6% |
| Last year | 14.1% | 114.3% | -6.2% | -4.0% | 2.9% | 1.6% | 7.8% | 20.1% | 7.3% | 15.8% |
| Last three years | 36.7% | 400.0% | 8.2% | 200.0% | -10.5% | 106.7% | -1.1% | 83.2% | 13.9% | 101.4% |
| Last five years | 30.2% | -44.4% | 71.3% | 4.3% | 19.3% | -16.2% | 12.0% | -41.3% | 26.5% | -34.9% |
Copyright notice: All figures in this article are based on data released by the Land Registry. The numbers are derived from analysis performed by PutneySW15.com. Any use of these numbers should jointly attribute the Land Registry and PutneySW15.com.
November 8, 2011
Related links
|
