Putney Bus Routes Receive Most Complaints in London
Over 1,000 lodged about local routes last year
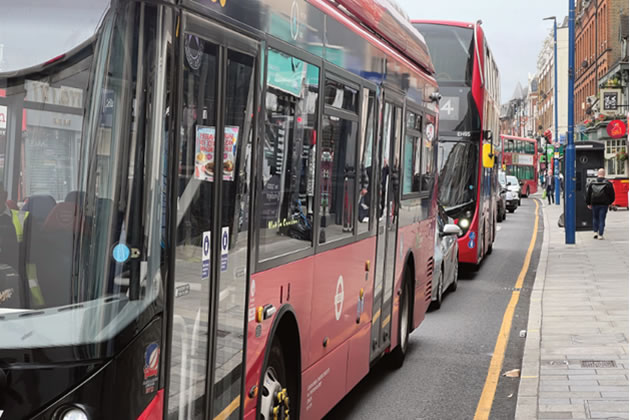
Buses queueing on Putney High Street. Picture: Putney Society
July 11, 2025
New data on the number of complaints by bus route across London has shown the highest number come from services passing through the Putney area.
In the latest year over 1,000 negative reports were submitted to TfL about numbers 14, 265 and 93 with only the 65 between Ealing and Kingston receiving more complaints in the year to the middle of this June. Complaints about all three local services have risen significantly over the last three years to their highest ever level.
In addition, the 85 received 272 complaints making it the 16th most reported for poor service.
The 265, between Putney Bridge and Tolworth, has previously been described as a “ghost bus” due to regular cancellations and bypassing stops when full to capacity. TfL has acknowledged issues with the service saying that traffic caused by roadworks as well as mechanical issues have affected schedules. It has drawn up an action plan with the operator, Go Ahead, in an attempt to improve reliability.
Route 93, which runs from Putney Bridge to North Cheam, is now fully converted to zero emission vehicles but has a rush hour average speed of just 7mph below the average of 9.1mph for the network.
However, this is rapid compared to route 14 which has an average speed of 5.5mph, dropping to 5.3mph during rush hour. Passengers also complain about early terminations.
One of the reasons for the 85’s unpopularity with passengers is the persistent early terminations of the service at Putney Heath which it is believed happen to artificially improve the services reliability indicators.
The figures were obtained by a Freedom of Information request by the Liberal Democrat Party which showed there were over 70,000 complaints lodged last year with Transport for London (TfL) .
Five years of data were requested but TfL only retains information back for three years and so the figures are for each year since 17/6/2022. TfL cautions that simple comparisons between routes may not be ‘particularly insightful, due to differences in number of passengers, frequency or journey length. A request for the data on complaints broken down by borough was denied as that information is not collated.
| Bus Routes Ranked by Number of Complaints Last Year | ||||
|---|---|---|---|---|
Bus Route |
Year 1 |
Year 2 |
Year 3 |
Grand Total |
65 |
516 |
381 |
443 |
1340 |
14 |
95 |
151 |
376 |
622 |
265 |
159 |
309 |
345 |
813 |
93 |
187 |
224 |
345 |
756 |
154 |
182 |
261 |
342 |
785 |
18 |
364 |
313 |
320 |
997 |
1 |
111 |
440 |
300 |
851 |
176 |
211 |
247 |
300 |
758 |
133 |
138 |
238 |
299 |
675 |
381 |
197 |
222 |
285 |
704 |
Grand Total |
59973 |
69758 |
70030 |
199761 |
Source: TfL
A spokesperson for TfL said that the buses receiving the most complaints, were also among the busiest on the network adding, "London's buses are the most used form of transport in the city and are vital in ensuring safe, reliable and accessible travel. They connect communities across the capital and help reduce congestion and emissions, with upwards of four million journeys per day.
"We're committed to ensuring every bus journey is a positive experience, and we continually address the small minority of customer complaints that we receive.
"This includes our work to bring in new routes as part of the Superloop network, reducing journey times by investing in bus priority measures and improving the customer experience by rolling out new zero-emissions buses with innovative features and cutting-edge design."
The Lib-Dems said the figures revealed the "shocking state" of London's bus routes, with the volume of complaints pointing to "persistent problems with punctuality, reliability, and customer service.
"We need to see real investment in our bus network and proper accountability for routes that consistently underperform."
About 1.8 billion bus journeys are made in London each year - making the bus network the most-used mode of transport in the capital.
Like Reading Articles Like This? Help Us Produce More This site remains committed to providing local community news and public interest journalism. Articles such as the one above are integral to what we do. We aim to feature as much as possible on local societies, charities based in the area, fundraising efforts by residents, community-based initiatives and even helping people find missing pets. We've always done that and won't be changing, in fact we'd like to do more. However, the readership that these stories generates is often below that needed to cover the cost of producing them. Our financial resources are limited and the local media environment is intensely competitive so there is a constraint on what we can do. We are therefore asking our readers to consider offering financial support to these efforts. Any money given will help support community and public interest news and the expansion of our coverage in this area. A suggested monthly payment is £8 but we would be grateful for any amount for instance if you think this site offers the equivalent value of a subscription to a daily printed newspaper you may wish to consider £20 per month. If neither of these amounts is suitable for you then contact info@neighbournet.com and we can set up an alternative. All payments are made through a secure web site. One-off donations are also appreciated. Choose The Amount You Wish To Contribute. If you do support us in this way we'd be interested to hear what kind of articles you would like to see more of on the site – send your suggestions to the editor. For businesses we offer the chance to be a corporate sponsor of community content on the site. For £30 plus VAT per month you will be the designated sponsor of at least one article a month with your logo appearing if supplied. If there is a specific community group or initiative you'd like to support we can make sure your sponsorship is featured on related content for a one off payment of £50 plus VAT. All payments are made through a secure web site. |