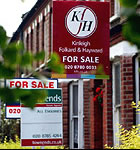
Party Over for Putney Property?
Bankers' bonuses fail to provide boost in house prices
The latest official figures from the Land Registry are suggesting that Putney property prices have started to fall.
After reaching record levels in the previous quarter the average price of a home in SW15 fell to £511504 in the three months to the end of 2010. This is down by 5.7% on the previous quarter but still 4.0% up on the same period last year.
A flood of buying due to high bonuses from the City has failed to materialise and, in fact, the weakest sector of the market relatively was the top end with far fewer larger homes selling compared to previous periods. On the other hand flats, which had lagged the price increases in the area, saw an increase in price and sales during the period.
London as a whole remains by far and away the strongest area in the country in price terms with home values rising by 6.2% in December compared to the same month in 2009. The average London property now costs £342,325. For England and Wales as a whole property prices rose by 1.5% with many areas of the north seeing falling values over the year. The average home price in the U.K. is now £163,814.
Putney Property Prices (October - December 2010)
| Area | Detached | Sales | Semi-Det | Sales | Terrace | Sales | Flat/ Mais |
Sales | Total Ave | Total Sales |
|---|---|---|---|---|---|---|---|---|---|---|
| SW15 1 | 0 | 0 | 1099490 | 5 | 1062033 | 15 | 369575 | 22 | 703776 | 42 |
| SW15 2 | 0 | 0 | 662666 | 3 | 707666 | 12 | 376308 | 37 | 469296 | 52 |
| SW15 3 | 673333 | 3 | 0 | 0 | 0 | 0 | 323160 | 29 | 355989 | 32 |
| SW15 4 | 0 | 0 | 0 | 0 | 0 | 0 | 148333 | 3 | 148333 | 3 |
| SW15 5 | 0 | 0 | 422166 | 3 | 589696 | 24 | 278277 | 9 | 497880 | 36 |
| SW15 6 | 0 | 0 | 1543987 | 4 | 594500 | 8 | 364428 | 28 | 528398 | 40 |
| Total | 673333 | 3 | 995193 | 15 | 734427 | 59 | 348275 | 128 | 511504 | 205 |
| Last quarter | -62.4% | -57.1% | -15.3% | -40.0% | 13.2% | -3.3% | 2.1% | -16.9% | -5.7% | -17.0% |
| Last year | -49.4% | -70.0% | -31.1% | 114.3% | 9.0% | 20.4% | 7.1% | -11.1% | 4.0% | -2.4% |
| Last three years | -7.8% | 0.0% | -20.4% | 25.0% | 10.2% | 11.3% | 1.3% | -31.2% | 11.6% | -19.3% |
| Last five years | -41.4% | -70.0% | 45.2% | -28.6% | 59.1% | -18.1% | 23.9% | -46.2% | 38.4% | -39.9% |
Copyright notice: All figures in this article are based on data released by the Land Registry. The numbers are derived from analysis performed by PutneySW15.com. Any use of these numbers should jointly attribute the Land Registry and PutneySW15.com.
February 15, 2011
Related links
|
