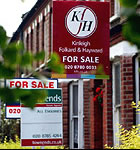
Putney Property Prices Tumble
Recovery in previous quarters proves short lived
 The latest official figures from the Land Registry are showing that Putney property prices have tumbled sharply and volumes are also falling alarmingly.
Prices are down by over 14% over the year and the number of transactions have fallen by around two-thirds. The average house in Putney now costs £386,413.
No detached or semi-detached homes were sold during the period.
This contrasts sharply with the previous quarter which saw prices hit a record high - despite the credit crunch and the generally gloomy economic situation. Prices have fallen by nearly 25% compared with the previous period although the level of the fall may have been influenced by the mix of properties sold with a higher proportion of flats changing hands.
The data for January for the country as a whole shows an
annual house price change of
-15.1 per cent. This
marks the seventeenth month in
a row where the annual rate of
change has fallen. This contrasts
with the 21 months of
uninterrupted increases in the
annual rate of change between
December 2005 and August
2007. Prices in London were down by 14.1% over the year.
The average property in England and Wales is currently
worth £156,753 and the rate of
monthly price change stands at
-0.8 per cent.
Sales volumes nationally have continued to
decrease, with the number of
sales averaging 41,014 per
month in the months August to
November 2008. In the same
period in 2007, the average was
106,495
 Tim Warren of Warren's commented,
"Interesting to see the Land Registry figures reflecting what has been evident in the market for some months now and yet still understandably lagging behind. Currently values are up to 30% off the peak, difficult to predict if they will drop further but one would hope that we’re nearing the bottom after a turbulent seven months.
Much has been made in the media regarding increased viewing levels although it is still very difficult converting these into sales. Part of the problem is with some purchasers failing to appreciate which of the price guides are right on the button and which have been bumped up 10% or more to allow offers. As we approach what is traditionally the busiest time of the year let’s hope for some stability in the property market and an eventual conclusion to the daily diet of horror stories from the financial world!"
The numbers are subject to revision as usually some properties are added late to the Land Registry's database.
Putney Property Prices - October - December 2008
| Area | Terraced | Sales | Flat/Mais | Sales | Total Averages | Total Sales |
| SW15 1 | 665250 | 10 | 393272 | 11 | 522785 | 21 |
| SW15 2 | 0 | 0 | 357226 | 18 | 357226 | 18 |
| SW15 3 | 306500 | 3 | 364312 | 8 | 348545 | 11 |
| SW15 4 | 0 | 0 | 172666 | 3 | 172666 | 3 |
| SW15 5 | 402500 | 4 | 380714 | 14 | 385555 | 18 |
| SW15 6 | 459166 | 3 | 293693 | 16 | 319820 | 19 |
| Total | 527975 | 20 | 345966 | 70 | 386413 | 90 |
| Last quarter | -29.3% | -33.3% | -7.0% | -30.7% | -24.4% | -36.6% |
| Last year | -20.8% | -62.3% | 0.6% | -62.4% | -15.7% | -64.6% |
| Last three years | 14.4% | -72.2% | 23.1% | -70.6% | 4.6% | -73.6% |
| Last five years | 40.5% | -77.3% | 29.3% | -76.8% | 21.0% | -78.2% |
Copyright notice: All figures in this article are based on data released by the Land Registry. The numbers are derived from analysis performed by PutneySW15.com. Any use of these numbers should jointly attribute the Land Registry and PutneySW15.com.
March 2, 2009
Related links
|
Warren The Putney Estate Agents Do Catchment Areas Matter in Putney? PutneySW15.com's property database is the most comprehensive for the area on the web - make sure your agent is listed there Property for sale in Putney Sign up for our free weekly newsletter |