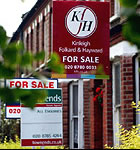
Putney Agents Braced for Tough Times
Prices down and volumes plummet in local property market
 For the second quarter in a row Putney property prices saw a fall of around 8% as prices tumbled from the peak seen last year.
More worrying still for agents is the dramatic fall in volumes. Transaction levels were down by 48.4% on the same period last year. There were no sales at all of detached properties during the quarter. Some significant retrenchment amongst local agents looks inevitable. Agents in other parts of London have been closing offices and it cannot be long before there are casualties in the Putney area if volumes continue at this level.
The average property in SW15 had reached a new record and broken through the half a million pound mark during the third quarter of last year.
The latest quarterly data from the Land Registry is showing that prices in the Putney area rose by 2.5% over the last year. However, subsequent quarters are likely to show falls on an annual basis as the market starts to be compared with peak periods. The average home in SW15 now costs £417,826 compared with £458,459 at the end of last year.
There were however pockets of strength in the market. Terraced houses in the SW15 area have risen by over 10% over the last year and 50% over the last three years.
Prices in London as a whole were up by 10.5% with the average property costing £357,675. London is still seeing the highest levels of increase in the country.
House prices in England and Wales dropped by 0.4 per cent in March compared to February, taking the average price to £184,798. It is the second consecutive monthly fall for England and Wales since August 2005. Over the year prices were up by 3.6%
The numbers are subject to revision as usually some properties are added late to the Land Registry's database.
Putney Property Prices - January to March 2008
| Area | Semi-Det | Sales | Terraced | Sales | Flat/Mais | Sales | Total Averages | Total Sales |
| SW15 1 | 0 | 0 | 786700 | 10 | 433066 | 15 | 574520 | 25 |
| SW15 2 | 0 | 0 | 677708 | 12 | 425500 | 25 | 507297 | 37 |
| SW15 3 | 506242 | 7 | 706666 | 3 | 331184 | 32 | 387180 | 42 |
| SW15 4 | 0 | 0 | 0 | 0 | 197750 | 12 | 197750 | 12 |
| SW15 5 | 0 | 0 | 352872 | 9 | 319870 | 12 | 334014 | 21 |
| SW15 6 | 0 | 0 | 736862 | 4 | 283738 | 21 | 356238 | 25 |
| Total | 506242 | 7 | 637968 | 38 | 341037 | 117 | 417826 | 162 |
| Last quarter | -59.5% | -41.7% | -4.3% | -28.3% | -0.8% | -37.1% | -8.9% | -36.2% |
| Last year | -32.5% | -69.6% | 10.7% | -33.3% | 6.9% | -49.4% | 2.5% | -48.4% |
| Last three years | -28.2% | -65.0% | 50.5% | -9.5% | 37.7% | -22.0% | 19.2% | -25.7% |
| Last five years | -9.5% | -46.2% | 75.7% | -44.1% | 47.7% | -33.5% | 47.9% | -37.0% |
Copyright notice: All figures in this article are based on data released by the Land Registry. The numbers are derived from analysis performed by PutneySW15.com. Any use of these numbers should jointly attribute the Land Registry and PutneySW15.com.
May 18 , 2008