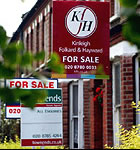
Last Hurrah for Putney Property?
Official numbers show SW15 average home just under half a million
 The latest quarterly data from the Land Registry is showing that prices in the Putney area rose by 19.1% in the latest period. The average home in SW15 now costs £498,976.
This is the highest number ever recorded and reflects a strong showing across all sectors of the market. The average Putney terrace now goes for £622,422 and if you live in the SW15 6 post code sector the average is £833,333..
The average was driven up by brisk turnover at the top end of the market. Multi-million pound houses in Roehampton saw particularly high activity but it wasn't just luxury properties that were moving quickly, local flat prices appear to have risen sharply over the last twelve months.
There is concern amongst many market observers that this may be the peak in the property market with increases in interest rates having little time to take effect the transactions that are represented in this data which is from the second quarter of this year.
Nationally properties were up by 9.2% over the last year to an average price of £181,227. London saw the average property costing £339,638 up by 16.0% according to the Land Registry house price index.
Putney Property Prices - April - June 2007
| Area | Detached | Sales | Semi-Det | Sales | Terrace | Sales | Flat/Mais | Sales | Overall | Total | |
| SW15 1 | 0 |
0 |
1,049,583 |
6 |
794,744 |
17 |
333,197 |
36 |
539038 |
59 |
|
| SW15 2 | 0 |
0 |
786,250 |
4 |
673,170 |
12 |
400,227 |
60 |
463640 |
76 |
|
| SW15 3 | 1,455,000 |
5 |
763,000 |
5 |
582,716 |
6 |
360,412 |
97 |
438462 |
113 |
|
| SW15 4 | 0 |
0 |
0 |
0 |
327,790 |
5 |
188,500 |
23 |
213373 |
28 |
|
| SW15 5 | 3,705,000 |
5 |
496,300 |
5 |
398,904 |
11 |
246,980 |
20 |
739855 |
41 |
|
| SW15 6 | 1,675,000 |
5 |
1,365,518 |
4 |
833,333 |
3 |
369,011 |
39 |
602520 |
51 |
|
|
2278333 | 15 | 883378 | 24 | 622442 | 54 | 344128 | 275 | 498976 | 368 | |
| Last quarter | 62.4% | 400.0% | 17.8% | 4.3% | 8.0% | -5.3% | 7.9% | 19.0% | 22.4% | 17.2% | |
| Last year | 44.3% | 50.0% | -1.0% | -7.7% | 19.4% | -25.0% | 34.8% | 44.0% | 19.1% | 23.1% | |
| Last 3 years | 95.9% | -6.3% | 35.7% | 26.3% | 34.9% | -28.0% | 37.2% | -9.2% | 45.6% | -10.9% |
Copyright notice: All figures in this article are based on data released by the Land Registry. The numbers are derived from analysis performed by PutneySW15.com. Any use of these numbers should jointly attribute the Land Registry and PutneySW15.com.
August 21, 2008
Related links
|
Warren The Putney Estate Agents Do Catchment Areas Matter in Putney? PutneySW15.com's property database is the most comprehensive for the area on the web - make sure your agent is listed there Property for sale in Putney Sign up for our free weekly newsletter |