Average Ealing House Price Reaches Record Level During Lockdown
Buyers snapping up large family homes despite the pandemic

Sixth highest price ever paid in West Ealing for St Leonards Road house
The average sale price of homes sold during the pandemic has reached record levels in Ealing confounding some expectations of a collapse in the market.
In both the W5 and W13 (West Ealing) postcode areas the latest figures from the Land Registry show an all-time high.
In W5 the average has risen by 27% compared with the same level last year to £900,807 and in W13 the level has increased by 27.9% to £854,021.
In both cases the average price is being driven up by a collapse in the number of sales of flats and the sales of larger properties remaining closer to the levels seen pre-pandemic.
Donald Collins, Sales Director at goview London said, “I knew coming out of the first lockdown the market would be very busy simply because sales transactions had been a lot lower for the four years it took to advance the Brexit vote to any meaningful mechanism.
“I thought this pent up demand would transfer post lockdown with buyers showing great willingness to purchase a larger home and I went on record stating to homeowners in the Borough not to be put off by the media scare stories that were coming through. This analysis proved to be spot on given the market recovered dramatically and we enjoyed as a company a record couple of months and more importantly our clients were delighted with the sale prices they achieved.”
Another local agent said, “The average price rise is more an indicator of a shift in the structure of the market than a generalised increase but, that said, prices have definitely held up very well and remain close to all-time highs.
“Mortgage approvals seem to be largely driving what is going on at the moment. People buying larger properties tend to have equity to bring to the table and so banks are much more willing to lend to them. However, as most institutions seem to have factored in a 10-15% fall in the market as a base scenario, they are very unwilling lend at high loan to equity ratios. This means that people buying smaller properties are often being asked to provide larger deposits than they can afford.
“Additionally the mortgage holiday has meant that there are few distressed sales at the moment. Combined with the stamp duty reduction, which is particularly significant for larger houses, this has meant that there weren’t really any bargains to be had. The deadline on the reduction has focused the minds of vendors and buyers and meant that a sale price is being agreed more promptly.
“This does raise the possibility of the market hitting a bit of an air pocket when mortgage holidays end and if stamp duty is raised again.”
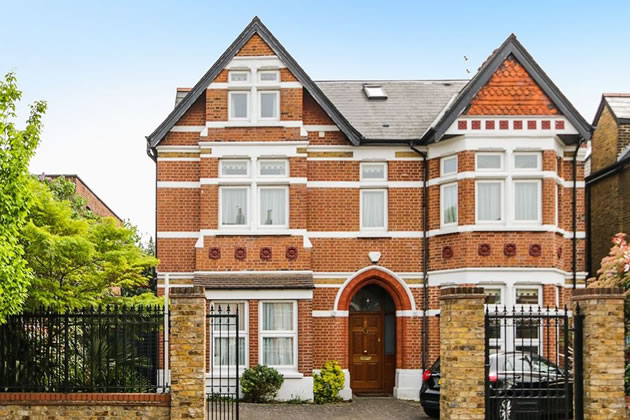
A sale of a detached house on Tring Avenue was transacted on 1 April, just after lockdown began for £2,500,000 and have been three more homes changing hands in the W5 postcode area since including detached houses on Park Hill and Grange Park and a flat in Skyline House in Dickens Yard that went for £2,300,000.

House in Tring Avenue sold just after lockdown began
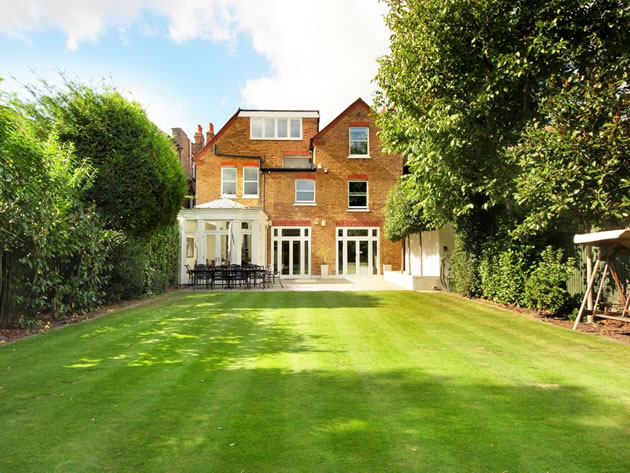
In West Ealing the sixth highest price ever in the W13 postcode area was paid for a detached house on St Leonards Road with seven bedrooms and three bathrooms. At £2,490,000 it went for just £10,000 below the listing price and it had first been put on the market by Sinton Andrews in January 2019 before being marketed by Orchards in February of this year.
| Ealing W5 Post Code Area Property Prices - (July - September 2020) | ||||||||||
|---|---|---|---|---|---|---|---|---|---|---|
| Area | Detached | Sales | Semi-det | Sales | Terraced | Sales | Flat/mais | Sales | Overall average | Total sales |
| W5 1 | 0 | 0 | 1074975 | 2 | 920000 | 3 | 529000 | 3 | 812119 | 8 |
| W5 2 | 1850000 | 1 | 0 | 0 | 0 | 0 | 982917 | 6 | 1106786 | 7 |
| W5 3 | 1253333 | 3 | 1130000 | 2 | 1165000 | 1 | 351250 | 2 | 985937 | 8 |
| W5 4 | 0 | 0 | 950000 | 1 | 820000 | 8 | 346375 | 4 | 684269 | 13 |
| W5 5 | 0 | 0 | 1418750 | 4 | 1068750 | 1 | 481750 | 2 | 1101036 | 7 |
| Total | 1402500 | 4 | 1226106 | 9 | 888750 | 13 | 619765 | 17 | 900807 | 43 |
| Change in Quarter | -5.3% | -60.0% | 14.8% | 12.5% | 20.5% | -23.5% | 17.5% | -15.0% | 6.7% | -21.8% |
| Change in year | -5.6% | -60.0% | 7.0% | -64.0% | 10.2% | -59.4% | 37.8% | -79.8% | 27.0% | -71.5% |
| Change in three years | -7.4% | -55.6% | 24.7% | -52.6% | 1.0% | -55.2% | 6.0% | -84.0% | 22.5% | -73.6% |
| Change in five years | -11.6% | -50.0% | 21.0% | -57.1% | 13.8% | -62.9% | 25.6% | -86.1% | 37.9% | -76.9% |
| Change in ten years | - | - | 95.4% | -57.1% | 75.8% | -66.7% | 119.2% | -76.7% | 100.7% | -69.3% |
Source: Land Registry
| Ealing W13 Post Code Area Property Prices - (July - September 2020) | ||||||||||
|---|---|---|---|---|---|---|---|---|---|---|
| Area | Detached | Sales | Semi-det | Sales | Terraced | Sales | Flat/mais | Sales | Overall average | Total sales |
| W13 0 | 0 | 0 | 313000 | 1 | 1046250 | 2 | 480000 | 1 | 721375 | 4 |
| W13 8 | 1509500 | 4 | 1125000 | 1 | 937000 | 1 | 340000 | 2 | 1097500 | 8 |
| W13 9 | 0 | 0 | 1082500 | 2 | 763143 | 7 | 441333 | 3 | 735917 | 12 |
| Total | 1509500 | 4 | 900750 | 4 | 837150 | 10 | 414000 | 6 | 854021 | 24 |
| Change in Quarter | - | - | -16.6% | -66.7% | 7.1% | -23.1% | 3.8% | -53.8% | 5.7% | -40.0% |
| Change in year | - | - | -11.1% | -73.3% | 15.8% | -71.4% | 1.4% | -81.8% | 27.9% | -71.8% |
| Change in three years | - | - | -19.1% | -71.4% | 4.8% | -72.2% | -15.7% | -87.8% | 20.0% | -76.2% |
| Change in five years | - | - | -4.8% | -81.8% | 7.3% | -78.3% | 2.7% | -90.5% | 31.1% | -82.1% |
| Change in ten years | - | - | 56.3% | -33.3% | 36.3% | 100.0% | 79.0% | -40.0% | 87.5% | 14.3% |
Source: Land Registry
Donald Collins adds, “Clearly, the landscape is very fluid and it is critical that homeowners get an accurate valuation figure to see what is achievable. A property with a proper, well thought-through valuation performs so much better in the market than one that has had an over-valued perspective put on it by an agent who is maybe looking to ‘win’ a listing but not serve their client.
“Critically, if you want to move and take advantage of the stamp duty holiday that ends on 31 March 2021, you need to instruct an agent who can demonstrate how they arrived at their valuation and how they intend to get you the best price possible.
“Go View London are trading from our two local offices within Governmental guidelines and we can conduct valuations. Please feel free to reach out via email sales@goviewlondon.co.uk or lettings@goviewlondon.co.uk and we would be delighted to help you make the move possible.”

Nationally the Nationwide House Price Index showed a year on year increase of 5% to £226,129 up to the end of September. For London the average has risen by 4.4% over the year to £480,857.
Robert Gardner, Nationwide's Chief Economist, said: “Housing market activity has recovered strongly in recent months. Mortgage approvals for house purchase rose from c66,000 in July to almost 85,000 in August - the highest since 2007, well above the monthly average of 66,000 prevailing in 2019.
“The rebound reflects a number of factors. Pent-up demand is coming through, with decisions taken to move before lockdown now progressing. The stamp duty holiday is adding to momentum by bringing purchases forward. Behavioural shifts may also be boosting activity as people reassess their housing needs and preferences as a result of life in lockdown.”
November 12, 2020