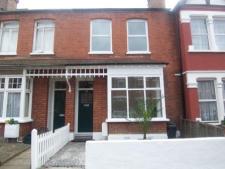
House Sales in Ealing Still on The Up
But W13 is currently doing better than W5
Property prices in Ealing are still ahead of the national average according to new figures. Prices in both W5 and W13 were up in the latest quarterly data from the Land Registry.
West Ealing (W13) was the best performing recently with a significant increase in the volume of sales compared to depressed levels last year. In the last quarter, 90 sales were recorded - a big jump of 130.8% in the year. The average cost for a house here is around £414,000 a change of nearly 22% on the year.
In W5 more properties changed hands (124) at an average price of £418,000 but the increase was much slower at just over 6% over the year.
Over the last three years the average property price in Ealing is more or less unchanged.
London overall experienced an increase of 12.2 per cent in June compared to last year. In comparison to this, the figure for England and Wales as a whole was currently 8.4 per cent. London’s house prices are now around the same levels they were three years ago.
London's monthly change brings the average house price there to £338,027, while the average for England and Wales is £166,072.
Looking ahead some analysts are not optimistic that the current price strength will be maintained.
Miles Shipside, commercial director of Rightmove, comments: “The number of new mortgages being approved each month is less than half the number of new sellers, with the imbalance being exacerbated by the increase of nearly 50% in the number of properties coming to market compared to a year ago. More aggressive pricing is now the order of the day, which means that conditions are ripe for a strong buyers’ market in the second half of 2010. This is likely to see the average price gains of 7% for the first half of the year wiped out by year-end, in line with Rightmove’s original forecast for the year of no net change in prices”.
Ealing Property Prices - April - June 2010
W5 Post Code Area
| Area | Detached | Sales | Semi-Det | Sales | Terraced | Sales | Flat/Mais | Sales | Total Ave | Total Sales |
| W5 1 | 0 | 0 | 551800 | 5 | 480979 | 12 | 256476 | 13 | 395498 | 30 |
| W5 2 | 0 | 0 | 0 | 0 | 0 | 0 | 293719 | 18 | 293719 | 18 |
| W5 3 | 1116562 | 8 | 741666 | 3 | 0 | 0 | 267950 | 12 | 624908 | 23 |
| W5 4 | 0 | 0 | 527416 | 6 | 436242 | 17 | 272272 | 20 | 372699 | 43 |
| W5 5 | 0 | 0 | 642500 | 4 | 0 | 0 | 289158 | 6 | 430495 | 10 |
| Total | 1116562 | 8 | 595471 | 18 | 454754 | 29 | 275608 | 69 | 418192 | 124 |
| Change in Quarter | - | - | -3.2% | -14.3% | -3.5% | 11.5% | -5.9% | 19.0% | 4.1% | 18.1% |
| Change in year | - | - | 1.8% | -25.0% | -3.5% | 61.1% | 8.4% | 60.5% | 6.3% | 45.9% |
| Change in three years | - | - | 13.2% | -30.8% | -3.2% | -55.4% | -4.6% | -42.0% | -0.3% | -44.4% |
W13 Post Code Area
| Area | Semi-Det | Sales | Terraced | Sales | Flat/Mais | Sales | Total Ave | Total Sales |
| W13 0 | 469916 | 6 | 440000 | 5 | 235062 | 8 | 363157 | 19 |
| W13 8 | 810993 | 8 | 0 | 0 | 256035 | 14 | 457838 | 22 |
| W13 9 | 490894 | 8 | 458479 | 29 | 259958 | 12 | 415154 | 49 |
| Total | 601572 | 22 | 455762 | 34 | 252485 | 34 | 414611 | 90 |
| Change in Quarter | -4.0% | 144.4% | 12.7% | 0.0% | 7.5% | 0.0% | 16.6% | 16.9% |
| Change in Year | 61.8% | 214.3% | 25.9% | 36.0% | 8.6% | 385.7% | 21.8% | 130.8% |
| Change in Three Years | 23.9% | 83.3% | 8.9% | 0.0% | -0.3% | 88.9% | -0.5% | 34.3% |
Data in this report is subject to crown copyright protection.
August 26, 2010
Related links
|
