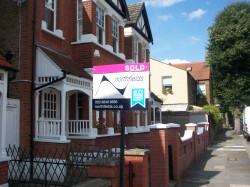
Ealing Property Market Back from the Brink
Relief for agents as sales more than double
Estate agents in Ealing can breathe a big sigh of relief as the latest official numbers on the local property show a sharp recovery in activity.
Sales in the area more than doubled in the previous quarter. Prices also appear to be strong but with volumes so low in the previous period it is hard to reach firm conclusions on market direction.
In W5, 85 properties have been reported as changing hands in the second quarter of the year, up from a miserable 36 in the first quarter, which was the lowest on record.
Kylie Menz Branch Manager at Northfields Estate agents agrees that things are looking up.
She says: '' We are experiencing the return of buyers to the market in great numbers. This results in increased levels of multiple offers being received, sales are mostly being agreed within 5% of the asking price and even some in excess of the asking price and although mortgages are still hard to come by, some prices in the Ealing area have actually returned to where they were at the peak of the market.''
The average price in W5 has risen by a quarter to £393,496 although much of that rise can be attributed to increased house sales.
Flat prices over the quarter were down but Kylie says overall demand is up: '' We have qualified buyers ready to move needing family houses in the local area. As a result of some of the lending criteria being relaxed the first time buyers market is also gaining momentum with a strong demand for 1/2 bedroom flats."
Prices are up by 1.3% over the year but this is misleading as each sub-sector of the market in W5 saw a decline over the year. The average has risen because there has been relatively more activity at the top end of the market.
West Ealing saw a similar recovery in volumes with transactions also doubling in the W13 area. Prices however were down by 15.7% over the quarter and 11.6% over the year. Once again it is the mix of sales that appears to be driving the average - sales of semi-detached houses in W13 recovered much more slowly meaning that cheaper categories of property made up a larger proportion of houses sold.
The figures for England and Wales as a whole show a modest improvement in the monthly change in house prices. The June increase of 0.1 per cent is the first time the monthly change has been positive since January 2008. The annual drop of 14 per cent took the average house price to £153,046.
London experienced the greatest monthly rise with a movement of 2 per cent, making it the region with the greatest monthly change and an average property value of £301,859.
All regions in England and Wales experienced a decrease in their average property values over the last 12 months.
The numbers below are subject to revision as is it usual that some properties are added late to the Land Registry's database.
Ealing Property Prices - April - June 2009
W5 Post Code Area
| Area | Semi-Det | Sales | Terraced | Sales | Flat/Mais | Sales | Total Averages | Total Sales |
|---|---|---|---|---|---|---|---|---|
| W5 1 | 527750 | 4 | 525400 | 5 | 225795 | 10 | 368208 | 19 |
| W5 2 | 535000 | 3 | 0 | 0 | 299073 | 13 | 343309 | 16 |
| W5 3 | 555500 | 4 | 0 | 0 | 248714 | 7 | 360273 | 11 |
| W5 4 | 451250 | 6 | 450403 | 13 | 189722 | 9 | 366794 | 28 |
| W5 5 | 769642 | 7 | 0 | 0 | 334375 | 4 | 611363 | 11 |
| Total | 584708 | 24 | 471236 | 18 | 254230 | 43 | 393496 | 85 |
| Change in Quarter | 67.1% | 700.0% | 24.2% | 38.5% | -3.8% | 115.0% | 25.7% | 136.1% |
| Change in year | -16.8% | 166.7% | -4.4% | -41.9% | -10.7% | -27.1% | 1.5% | -14.1% |
W13 Post Code Area
| Area | Semi-Det | Sales | Terraced | Sales | Flat/Mais | Sales | Total Averages | Total Sales |
|---|---|---|---|---|---|---|---|---|
| W13 0 | 0 | 0 | 333368 | 8 | 188000 | 6 | 271067 | 14 |
| W13 8 | 533375 | 4 | 0 | 0 | 198750 | 4 | 366063 | 8 |
| W13 9 | 371714 | 7 | 361860 | 25 | 232428 | 7 | 340397 | 39 |
| Total | 430500 | 11 | 354953 | 33 | 208823 | 17 | 327851 | 61 |
| Change in Quarter | -26.7% | 37.5% | 0.6% | 153.8% | -3.2% | 142.9% | -15.0% | 117.9% |
| Change in Year | -19.4% | -42.1% | -16.4% | 13.8% | -18.9% | -58.5% | -11.6% | -31.5% |
Data in this report is subject to crown copyright protection.
August 13, 2009
Related links
|
