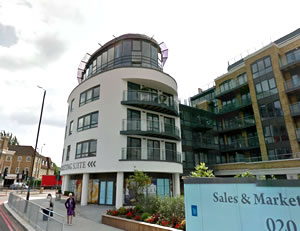
Brentford Property Market Breaks Turnover Record
Over two hundred properties change hands in the second quarter
The latest figures on the property sales in the TW8 post code area show that the number of transactions in the local property market has reached a record level.
During the second quarter of 2014 there were 207 homes sold in the area, nearly double the level seen in the previous three months and more than twice the same period last year.
The period also saw the average price bounce back from previous quarters up to £421,609, a 20% increase from the level seen in the first three months of the year. That just brings prices back to the record level seen during the same period in 2013.
Of the 207 sales 191 were of flats with most of these being sold east of Boston Manor Road.
The average price in London during the month of June was £437,608 which is up by 16.4% compared with the same month in 2013. For England and Wales as a whole the average is now £172,011 compared with the peak of £181,466 in November 2007 up by 6.4%.
The most up-to-date figures available show that during April 2014 the number of completed house sales in England & Wales increased by 31 per cent to 66,659 compared with 51,022 in April 2013.
The number of properties sold in England and Wales for over £1 million in April 2014 increased by 39 per cent to 1,028 from 740 in April 2013.
A list of properties sold in the Brentford area will appear in a forthcoming edition of the BrentfordTW8.com newsletter.
| Brentford Property Prices - (April - June 2014) | ||||||||||
|---|---|---|---|---|---|---|---|---|---|---|
| Area | Detached | Sales | Semi-detached | Sales | Terraced | Sales | Flat/ mais |
Sales | Overall Ave | Overall Sales |
| TW8 0 | 0 | 0 | 320000 | 1 | 475000 | 5 | 434741 | 135 | 435355 | 141 |
| TW8 8 | 450000 | 1 | 0 | 0 | 0 | 0 | 401256 | 45 | 402315 | 46 |
| TW8 9 | 0 | 0 | 532250 | 4 | 454700 | 5 | 270818 | 11 | 369075 | 20 |
| Total | 450000 | 1 | 489800 | 5 | 464850 | 10 | 417411 | 191 | 421609 | 207 |
| Change in Quarter | 15.9% | -37.5% | -0.6% | -47.4% | 32.5% | 148.1% | 20.1% | 99.0% | ||
| Change in year | -7.6% | -28.6% | 18.6% | -47.4% | -0.9% | 189.4% | -2.4% | 120.2% | ||
| Change in 3 years | 41.0% | 0.0% | 28.3% | 42.9% | 74.2% | 306.4% | 60.1% | 250.8% | ||
| Change in 5 years | 98.8% | -28.6% | 65.2% | 0.0% | 70.4% | 1023.5% | 64.7% | 508.8% | ||
| Change in 10 years | 68.3% | -75.0% | 64.5% | -72.2% | 51.7% | 148.1% | 50.8% | 55.6% | ||
| Brentford Property Prices - (January - March 2014) | ||||||||
|---|---|---|---|---|---|---|---|---|
| Area | Semi-detached | Sales | Terraced | Sales | Flat/ mais |
Sales | Overall Averages | Overall Sales |
| TW8 0 | 420000 | 2 | 468375 | 12 | 313786 | 47 | 347679 | 61 |
| TW8 8 | 338667 | 3 | 387000 | 3 | 348103 | 17 | 351946 | 23 |
| TW8 9 | 508317 | 3 | 525625 | 4 | 275712 | 13 | 360585 | 20 |
| Total | 422619 | 8 | 467579 | 19 | 314934 | 77 | 351105 | 104 |
| Change in Quarter | -19.2% | 100.0% | 12.7% | -5.0% | 3.2% | -31.3% | 7.1% | -23.5% |
| Change in year | 9.0% | 100.0% | 18.8% | 18.8% | -29.1% | 30.5% | -18.6% | 31.6% |
| Change in 3 years | -2.3% | 100.0% | 46.5% | 171.4% | 16.5% | 285.0% | 16.2% | 235.5% |
| Change in 5 years | - | - | - | - | 47.1% | 305.3% | 64.0% | 447.4% |
| Change in 10 years | 26.3% | 14.3% | 74.1% | -44.1% | 18.6% | -22.2% | 30.2% | -25.7% |
Where do I live? Brentford TW8 postcodes are divided into three sectors, TW8 0xx, TW8 8xx and TW8 9xx. Broadly speaking, TW8 0xx covers areas east of Boston Manor Road, TW8 8xx goes west of Boston Manor Road, whilst TW8 9xx covers the areas to the north of the A4.
Source: Land Registry
November 12, 2014
